MJ:数据可视化背景图
具有动态元素的信息图表/Infographic with dynamic elements:
Craft an infographic that incorporates dynamic elements, such as interactive bars or animated percentages, to bring life to statistics and figures --style raw --stylize 180 --ar 16:9 --v 6.0
制作一个包含动态元素的信息图表,例如互动条形图或动画百分比,使统计数据和数字更加生动

社交矢量插图/Social vector illustration:
Illustrate a line graph detailing social media engagement over time, with segments highlighting key campaigns and the ability to interactively explore different time periods --style raw --stylize 210 --ar 16:9 --v 6.0
插图一个详细的社交媒体互动随时间变化的线图,突出关键活动并能够互动地探索不同时间段

非传统数据映射/Unconventional data mappings:
Generate a unique data map that uses unconventional shapes and symbols to represent geographical data, offering an innovative twist on traditional mapping --style raw --stylize 250 --ar 16:9 --v 6.0
生成一个使用非传统形状和符号来表示地理数据的独特数据地图,为传统地图增添创新元素

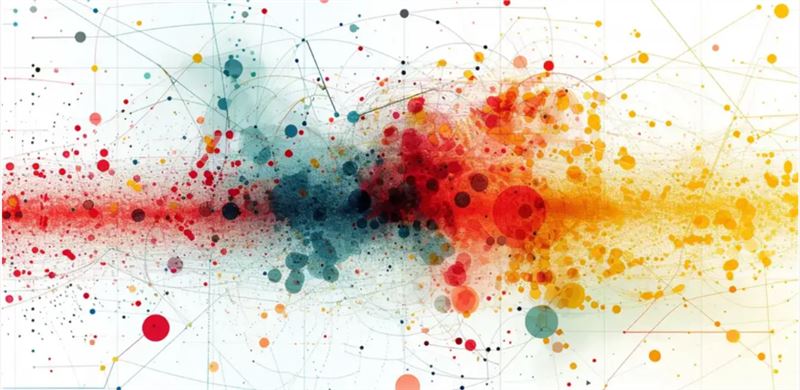
动态散点图/Animated scatter plot :
Create an animated scatter plot showing the economic growth of different countries, with interactive points that reveal more data on hover --style raw --stylize 220 --ar 16:9 --v 6.0
创建一个展示不同国家经济增长的动态散点图,互动点在悬停时显示更多数据
MJ:胶原蛋白美妆分子...
MJ:彩铅素描类插画...